 |
|||||||||
| |
|
|
|
|
|
|
|
|
|
"Oooh La La! Profiles
Unveiled"
|
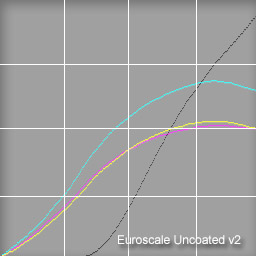
If you have WindowsPhotoshop 6 or later, check out the profile plotter actions. Curvemeister's Profile Plotter is a free Photoshop action that gives you a peek at what what the "wizard behind the curtain" is doing to your pictures. The Profile Plotter produces a graph called the Gray Ramp, or TRC (tone response curve), showing the amount of each color that would be used to produce shades of gray. |
|
Installation: Windows PhotoShop 6 through CS4
(Older version? Never fear, see below for earlier versions of Photoshop)
- Download the Curvemeister action file.
- Install the action by clicking on the action palette menu button, and selecting the "Load Actions" command..
- Locate the Actions palette, open the folder named Curvemeister.com, and click on the "CM Profile Plotter" action to highlight it, and then click on the arrow icon at the bottom of the palette to run it.
- The action will prompt you for a profile, as shown in the illustration. Select the profile that you want to be plotted from the drop down box.
- Click OK.
- Watch breathlessly as a bunch of strange windows perform gyrations on your screen.
- When the gyrations stop, a window containing a graph similar to the ones at the top of this page will appear.
- At this point, you may select the text layer and type in your own text, thus labeling your Tonal Response Curve for posterity.
- Troubleshooting - if you get an image that looks like the "flatline" on the right, don't worry, your profile is not dead. Just go back to step 3 and make sure the pattern is installed.
- Happy profile hunting! Remember, der Curvemeister cares, and wants to hear from you, .
Note: Use the RGB version of the action for RGB profiles, and the CMYK version for CMYK files, and you're golden.
Here's an example of a nice looking profile. It is plot of the Fuji Frontier at COSTCO in Honolulu. BTW, for a Fuji near you, profiles like this one are available for download at the DryCreekPhoto site.

Examples
Look for "jaggies" and "wooga woogas", as seen in the second plot below. You don't want those!
 |
 |
|
An OK, if rather dramatic and high-strung profile. |
Frankenprofile, made to strike fear into the hears of mortals, and banding! Luckily, this profile was created using a scanner from printed output, and never got out of its room in my basement... Wait ... Igor ... what;s that noise???! |
 |
 |
|
Folks
who frequent the COSTCO in Honolulu not only get to bask in the sun
and surf all day, they get a nice looking profile on their Fuji Frontier!
|
Another professionally produced profile, stil busy printing photographs in California. Notice almost an eighth of the color values are mapped to pure black.
|
|
The profile monstrosity in the upper right corner was generated by yours truly using an inexpensive scanner to evaluate printer output. The result: a poorly constructed profile, guaranteed to produce banding. Yes, bands of villagers marching to your castle door in an angry torch light procession, as well as bands of color on some of your prints. The profile in the bottom right means that COSTCO customers in Richmond California will lose most of their shadow detail - who knew? If this sort of thing interest you, here is a discussion of the Epson 1200 profile. |
|
|
Note: The profile plotter is really only of interest for generated device profiles, such as those produced using consumer measuring devices. Most working space and monitor profiles will show as a boring, straight diagonal white line. |
| Windows Photoshop 5.0 and 5.5 | |
|
|
|
Removing the profile plotter |
|
|
1. Delete the
action itself by dragging the der Curvemeister action folder to the trash
can in the actions palette.
|
 |
|
|
2. For Photoshop 5, remove the psd files you installed in the C: partition. |

| Notes and Questions | |
|
For PS 6 owners who like to hack, PhotoShop has a small icon you may click to enable the text dialog at the end of the action, and the action will hang up toward the end, waiting for you to type text that will appear in the place of the normal "der ProfileMeister" at the bottom of the graph. PS 5.0 and 5.5 owners can modify the resulting plot file, or edit the contents of derCurveMeisterPS5.psd. You may alter the "grid" layer any way you choose. Do not alter the "FlatLine" or "Gradient" layers of this file or your plots will look very weird. Why no Macintosh version? The action actually sort of runs, and a save dialogs pop up due to path name differences between Windows and Macintosh. You may fix this by re-recording the steps in the action that refer to files, so that they refer to a folder on your system's hard drive instead of the C: drive that is guaranteed for all windows systems. Here are more detailed instructions on how to do this. Macintosh users also have some interesting (and free) tools available at Icctools.com. Some profiles contain more information than der Curvemeister's plot displays. In particular, color profiling is computed in CIE-XYZ color space, and in that ethereal realm the curve of one color may depend on the values of the other colors. Der Curvemeister has addressed this issue with another free download, LabMeter. Why do some profiles, such as Adobe RGB, Apple RGB, and Wide Gamut RGB show up as just a straight line? These profiles manipulate color gamut, and have no effect on the ratios of red, green, and blue that create neutral colors. The result is a boring straight line. If you are interested in viewing gamut information, check out Curvemeister's free gamut plotter image. The CMYK Plotter action: dot Gains derived from this display are now more reliable. Version 3 of this action used Lab instead of CMYK to generate the intial gray ramp, and this has been changed to used the K channel of the current CMYK profile to generate the ramp before converting to your desired profile for plotting purposes. The result is a display very close to that of Photoshop's custom CMYK dot gain plot.
|
Why is the image/pattern required for PS5/PS6? Well, as of PhotoShop 5, it is impossible to generate a linear gradient! So der Curvemeister has to get it from a file. This problem has been fixed in Photoshop 6 and later, so there you have it: History! Are the generated plots dependent on the working space or the monitor profile? Yes, and no. The RGB version of the profile plotter shows the effect of the profile when used to convert from your working space to the selected profile.Your monitor profile plays no role in the profile plot How should I interpret the plots? What are the x- and y-axis? Yes. The profile plotter works by creating a black to white gradient, converting it to the profile you specify, and plotting the new RGB values. You can do this yourself by laying down a gradient and converting it, then looking at the individual channels, looking for any bad banding. It's easy to fall for optical illusions which can overemphasize banding. The info palette is useful for this, to see if there are significant flatspots or areas with negative slope, and you can cross check this with the profile plotter - each glitch in the plotter graph will correspond to a band in your converted gradient. Macintosh folks: Due to disk volume naming issues on OSX and MacOS, the profile plotters, as distributed, are Windows only actions. These actions may be modified to run on Macintosh by hard coding a folder name that is known to be on your particular system. No C: drive? Gaaah! It has recently come to my attention that some windows systems have no C drive. If your system is set up this way, you are in the same boat as the Macintosh folks, and need to create your own customized action, changeing all references to C: to <your drive letter here>:. |
|
 Site designed by Paradox Media |